TDE Rebuild using up all your Tableau Server Resource?…Try using the SDK

Overloading Resources
Despite the smiles…overloading your resource isn’t a good idea!

Why would I want to do this?

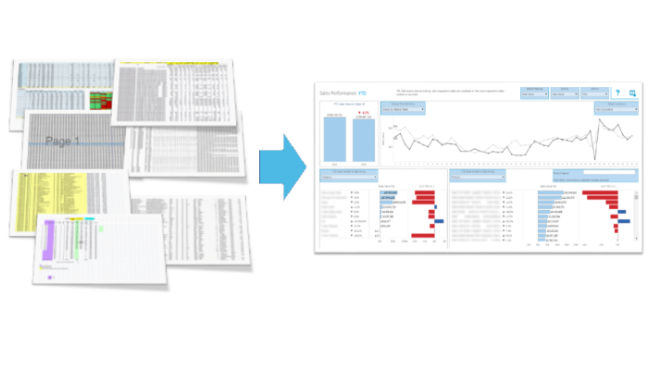
Tableau Server resource is a valuable commodity and one of the activities which use this, like no other, is the rebuilding/refreshing of Data Extracts (TDEs). At Atheon, our data (usually) refreshes each day, with many hundreds of extracts to refresh. This uses a huge Continue reading TDE Rebuild using up all your Tableau Server Resource?…Try using the SDK

My Indian Advizture

So (what now seems an age ago) I took my annual holiday, and went back (for the 5th time) to my favorite country…India.

While digging out the back-pack from the back of the wardrobe, I came across our stash of photo’s…about 5 albums of old holidays, and a huge box of photos in the pending/holding-queue! (this will mean nothing to anyone under 30, who may never have owned a physical photograph 😀 ). I also have copious amounts of pen-drives, hard-drives and clouds of other holiday photos, which rarely get an outing. So while we were away…travelling about, having a wicked time, taking snaps I was trying to think of a better way to create a holiday album Continue reading My Indian Advizture

Chasing rainbows

It cropped up again last week; the dreaded statement from a BI professional

We must have a single version of the truth…

Anyone working in IT / BI / decision support / enterprise reporting / analytics etc. for more than a couple of months will have heard this, and for those of us working in the field for 20+ years we may wince slightly and wish that we had a pound for every time…
Continue reading Chasing rainbows

The Importance of Granularity (…to Blend or not to Blend?)

The ‘Granularity’ (or ‘Grain’) of the data is the most important thing I consider for any data analysis. When I get a new data-set, my first question What is the Granularity? When designing a new (Tableau) visual model, my first consideration What Granularity do I need? When calculating a measure (or KPI), my first questions: What is the Granularity? and What Granularity do I need?

I’d go as far as saying “Understanding the Grain of your data is 99% of the solution”… Continue reading The Importance of Granularity (…to Blend or not to Blend?)

In praise of *unactionable* insight

One of the most common requests from my clients is for Actionable Insight; a desire to receive simple, understandable output from analytical activity which provides a clear indication for what they should do. As a request it’s entirely understandable, reasonable and a great focus for the majority of analysis; after all, analysis is most valuable when it directs action and results in improvement. There are, however, two clear cases when the desire for Actionable Insight oversteps the mark and misses the point:
Continue reading In praise of *unactionable* insight

Managing by Averages… of Averages

Much of my visual analysis is performed to help large companies – usually retailers and their suppliers – to better understand a perplexing problem or opportunity in their organisation. How can we reduce waste in our stores? Which promotions drive the desired behaviour in customers and why? What effect does non-delivery at depot have on availability in store? What’s the optimum product range for our biscuits category? etc.

Continue reading Managing by Averages… of Averages

Sheet Swapping using Dashboard Actions (or the Illusion of a Full Outer Join on Blended Data)

As the title suggests, this nifty trick has the dual purpose of allowing you to trigger sheet swaps using Dashboard Actions and, when two data sources contain different levels of Granularity, it lets you analyse at both levels (the Granularity of the Primary and Secondary data source). This is the ‘illusion of a Full Outer Join’…All seems a little cryptic and techie. Let’s run through an example…

Sheet Swapping on Action